Introduction
I was interested in a genealogy of music genres using Wikipedia as a reference. I had some success, no doubt more to learn.
wptools
My first look at the data on wikipedia website was with wptools. wptools allows you to download wikipedia html and scrape data from them, for example content from info boxes.
I could have parsed that data into a linked list and then used that linked list to create a network map using GraphViz but before I had a chance to write that code I discovered dbpedia.
YASGUI, dbpedia and SPARQL
dbpedia is basically a database version of wikipedia. Or another way to put it is a machine readable version of wikipedia that can be queried.
The data is stored in RDF and queried using SPARQL. I have to say, RDF and SPARQL were easily the biggest obstacles. It is a very generic language, somewhat like SQL but not like SQL and I found it extremely difficult to use. But in the end it us for querying columnated data of sorts and I was able to pull some queries together.
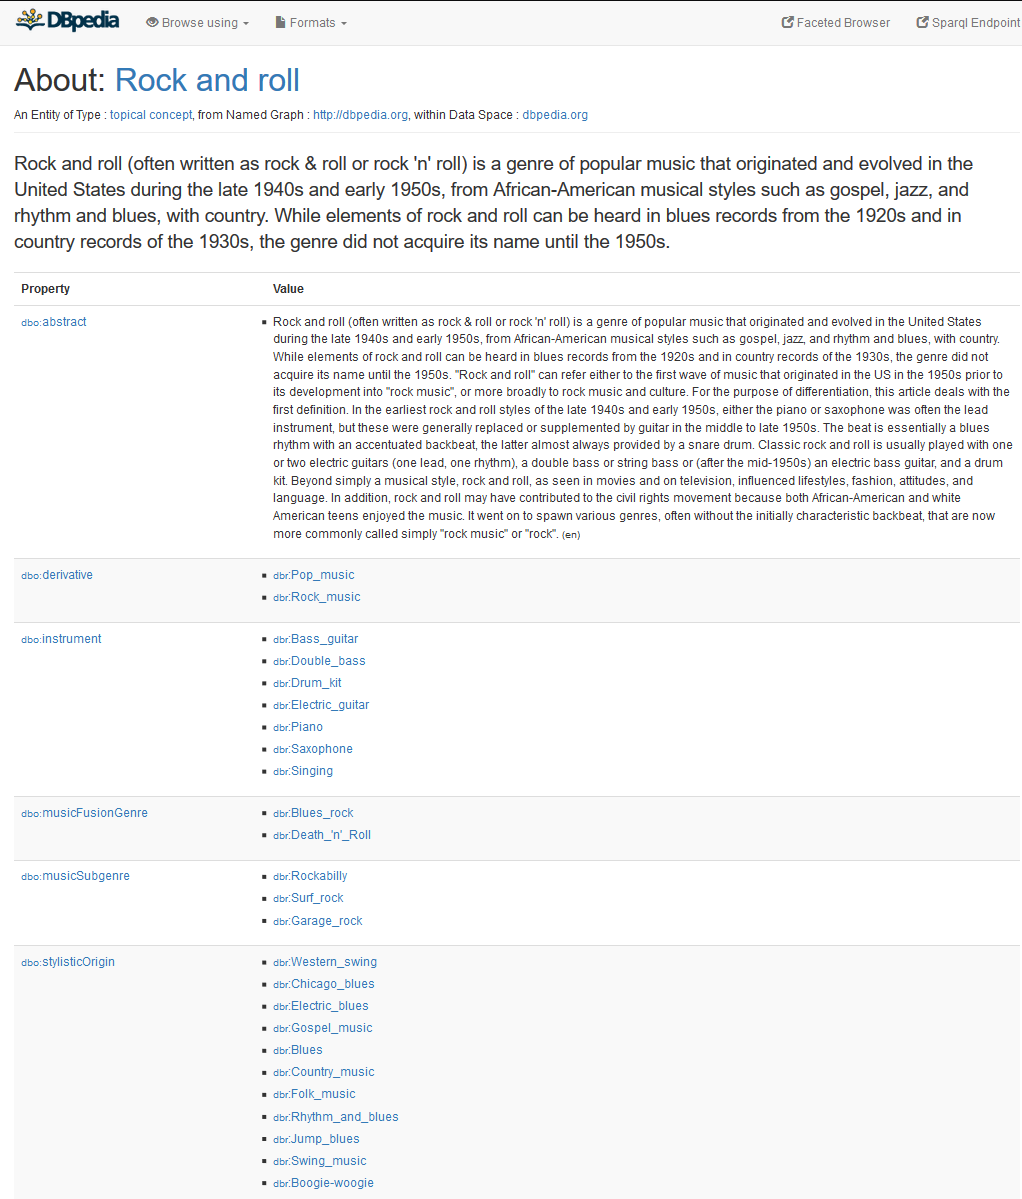
An example of a wikipedia page which has been scraped, stored in a database as RDF, queried and made readable again in table format is Rock and Roll.
My first attempt to pull a genealogy was based on using foaf:name to make it legible. I used the YASGUI service:
PREFIX db:

PREFIX dbo:

PREFIX dbr:

PREFIX dbp:

PREFIX foaf:

PREFIX rdfs:
SELECT ?soClean ?genreClean

WHERE {

?genre_type a dbo:Genre .

?genre_type dbo:stylisticOrigin ?stylisticOrigin .

?genre_type foaf:name ?genreClean .

?stylisticOrigin foaf:name ?soClean .

}
This proved to be a bad idea because... Wikipedia's data quality is very poor.
Second time I pulled only the raw names along with some "cultural origin" data which looked mostly like decade of origin so I thought that might be handy:
PREFIX db:

PREFIX dbo:

PREFIX dbr:

PREFIX dbp:

PREFIX foaf:

PREFIX rdfs:
SELECT ?stylisticOrigin ?genre_type ?co

WHERE {

?genre_type a dbo:Genre .

?genre_type dbo:stylisticOrigin ?stylisticOrigin .

?genre_type dbp:culturalOrigins ?co .

}
This provided several thousand rows of data. Ok cool! I download that data as standard CSV and it is available here.
GraphViz
Next step is to graph the data. I wrote a python script which reads in the csv and outputs a file in the graphviz language.
import csv
from graphviz import Digraph
import os
import sys

#hack needed to read the YASGUI/dbpedia exports correctly
reload(sys)
sys.setdefaultencoding('utf8')

csvfilename="raw_names.csv"
genrefilename="genres.gv"
chartfilename="genres"
charttype="png"

print("hello")

print("buidling graphviz tree")
g=Digraph('genres', format=charttype, filename=chartfilename,
        edge_attr={'penwidth':'1', 'weight':'0.1', 'fontsize':'12', 'color': 'blue', 'fontcolor':'blue' },
        graph_attr={'fixedsize':'false', 'bgcolor':'white'},
        node_attr={'fontsize':'64', 'shape':'plaintext', 'color':'none', 'fontcolor':'black'}
        )
g.attr(layout="twopi")
g.attr(overlap="true")
g.attr(nodesep='12')
g.attr(ranksep='12')
g.attr(size='3000,3000')

print("populating from %s" % csvfilename)
with open(csvfilename, 'rb') as csvfile:
        csvline = csv.DictReader(csvfile, delimiter=",", quotechar="|")
        for row in csvline:
                #print(row)
                gtext=row[' "genre_type" '].rsplit('/',1)[1]
                stext=row[' "stylisticOrigin" '].rsplit('/',1)[1]
                g.node(gtext, gtext)
                g.node(stext, stext)
                g.edge(stext, gtext, constraint='false')

print("writing gv file %s" % genrefilename)
f = open(genrefilename, "w")
f.write(g.source)
f.close()

print("writing %s.%s" % (chartfilename,charttype))
g.render()
That is available raw_names.csv and genres.gv.
That script also performs the render. It's big. Here is a resized version:
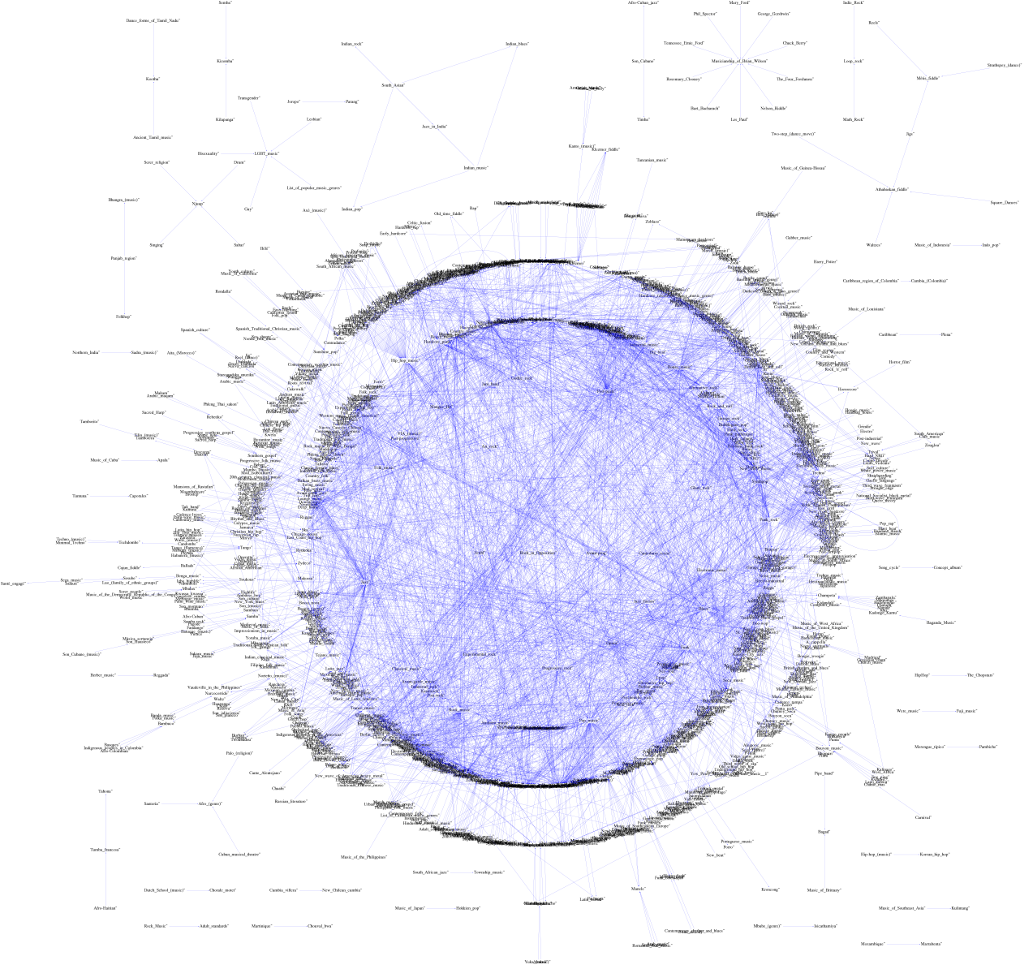
The original image is here.
My ability to clean up the image and have it legible (without dropping many of the genres) was limited by the massive image size and what seemed like limitations of the software. I am running an older version of Debian so perhaps I will upgrade it in the future and try again. Also, the nature of music influences will always be messy but Wikipedia isn't nearly as clean as I expected and the dataset just doesn't lend itself to a clean output.
NetworkX and Google Sheets
I also wanted to perform some analysis on the structure of the network and graphviz is really oriented towards graphical output only so for this I turned to networkx and google sheets. I felt like I had some insight into the major influences from the diagram and could have done more with networkx, what I really wanted was to know the original / primal sources of music. So I built a tree using this python code and found all nodes with no parents.
Unfortunately cultural origins and musical origins are so completely conflated in wikipedia that the output is useless. Almost all top level nodes are not musically related at all.
I could probably have used something more respectable than google sheets but for basic math and plotting Sheets is so profoundly easy to use these days, particularly with pivot tables which in google sheets are basically a GUI version of SQL on row data.
I used google sheets gratuitously to clean up data later on but I also used it here for a single query of top influencers. It really only looks at each node individually. What I could not determine, at least not without a significant amount of python code, was exactly how many children each node had. To me that was the most valuable contributor. It took about 30m to clean up the data and (literally) about 2-3m to produce this plot:
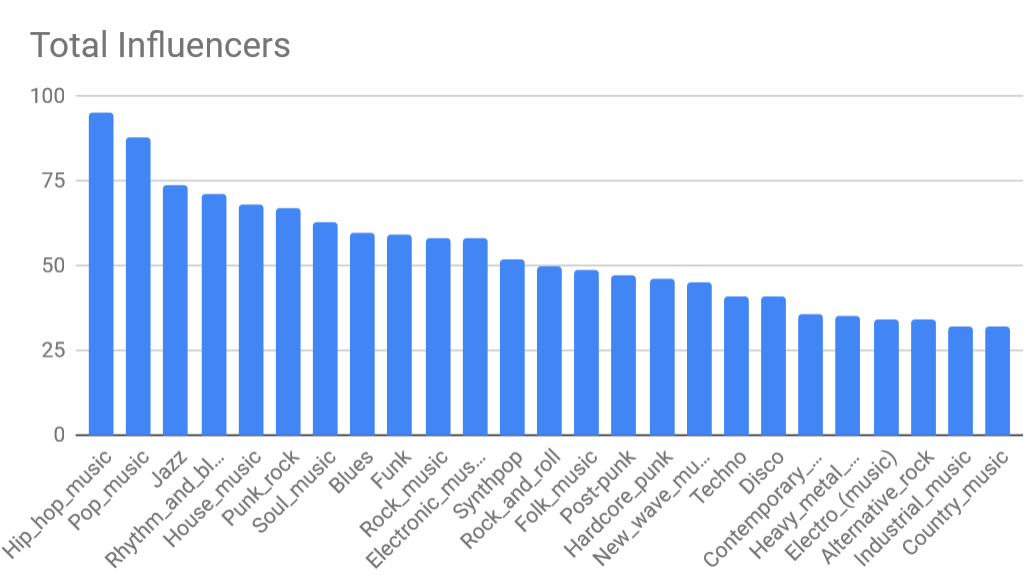
Data looks about like I'd expect it to.
Gephi
The next attempt was to use a Windows GUI tool to plot the data. Everything up to this point was on a linux console or a web browser (for the queries and research).
The same csv file was read in (with a slight modification, Gephi requires a specific Source and Target in the header row 1 of the file and it doesn't allow custom names to be assigned). Actually, I plotted many different files and used many different methods to categorize the nodes and edges. Unfortunately gephi does not appear to have a way to organize the data by year (ie decade). I would like to have put the oldest node clusters towards the middle and the newest node clusters towards the edge. It would have been fascinating to see if the age of the nodes/clusters were at all aligned with the connectivity between nodes.
Here is a nice sample of that effort:
And a gephi file is here for a couple more interesting examples.
DBpedia-Live and Wikipedia Data Service
Those attempts having met with good, but limited success, I was eager to find more detail but being limited by my own skills, especially with SPARQL, so my study quickly came to an end. There are two more resources which might be fruitful in the future.
The first is DBpedia-Live. The dataset I used above is from 2016 and dbpedia appears to no longer update it. DBpedia-Live (and its web query page) appears to be its replacement. It is updated live and tracks wikipedia as it's being updated nearly in real time. However, the data I was able to pull from that resource was much smaller and much dirtier. I don't know if this reflects wikipedia or dbpedia but it was a disappointing regression.
And at the very last minute I discovered that wikipedia has its own SPARQL interface! You can see many examples here. Unfortunately this is a code example for pulling music genres from the database. Seriously, what? How is that going to be useful?
#defaultView:Graph

SELECT ?item ?itemLabel ?_image ?_subclass_of ?_subclass_ofLabel

WHERE {

  ?item wdt:P31 wd:Q188451;

        wdt:P279 ?_subclass_of.

  SERVICE wikibase:label { bd:serviceParam wikibase:language "[AUTO_LANGUAGE],en". }

  OPTIONAL { ?item wdt:P18 ?_image. }

}
It does however, automatically produce a network graph (with pictures!) which is convenient.
Conclusion
My success was metered by:
- My knowledge of networks analysis skills
- Hardware and software limitations
- The vastly difficult SPARQL language
- How dirty wikipedia data is
My knowledge of network data analysis and tools was quite limited when I started this investigation. It has improved significantly, now being aware of some of the most common tools and some of the most common analyses that are used to gain insight into networks.
I was limited at times by the abilities of the software or my hardware. I find it hard to complain. Network analysis was nearly impossible a decade ago and now I have tools for producing graphics, queries (for numerical analysis). I also have well put together python libraries for scraping the web and wikipedia. It's pretty remarkable, even if they could use improvement.
SPARQL is horrible. It is extremely generic which is great for flexibility but it requires learning each systems particulars. Learning each database's tables or properties is significant enough but there is enough variation in querying language, and it's a language that to me is very confusing that I don't even want to use it.
In the future it would be interesting to launch a side project to clean up wikipedia's genealogy. Perhaps put together a clean dataset and a graph and publish it to the community (which one? where?) and encourage the music folks to get involved. Perhaps set some rules about what is a genre (e.g. cultural vs musical origins, proper dating of genres, instruments are not genres, people are not genres, the failure to properly integrate classical music, the failure to properly integrate "world" or traditional genres, geographical scenes in a specific city make not a genre, etc).
- Log in to post comments